
One day of tidal cycles on Casco Bay
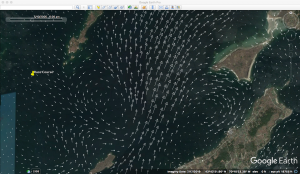
This section describes an animation of a numerical simulation of the current flow on Casco Bay using an early version of FVCOM (The Finite Volume Community Ocean Model) developed by some smart people out of UMass-Dartmouth. The currents are calculated based on tides, weather, temperature, and salinity, as well as the bathymetry.
Timeframe of simulation: 2000 May 9, 2005 to 2000 May 10, 2005 (I think I have this time correct – it converts to 0000 May 10 – 2400 May 10 in UTC time frame, which makes some sense)
The tide table times reported for Falmouth Foreside station on May 9/10, 2005:
1840 Low (5/9)
0052 High (5/10)
0719 Low
1333 High
1922 Low
Weather conditions feed the simulation, so here is a link to the weather record on that day: Weather on May 10, 2005
To view the animation…
A Casco Bay simulation is located at the following link: Simulation using Google Earth of surface currents in Casco Bay; to view the animation, follow the steps below:
- Open the link above (opens in new window)
- Click open the “Google Earth velocity fields” link (on the left sidebar)
- Click on the “Falmouth” map to download the Falmouth KMZ file(s) to your computer
- Open Google Earth (Pro)
- File > Open > one or all the .kmz files
- This will tie up your computer for a long time if you open all of them
- I recommend opening only the Falmouth file
- It will open in a “Temporary Places” folder
- You can move the KMZ files to another “Place” in Google Earth for future reference, but doing this seems to slow down re-launching Google Earth
- File > Open > one or all the .kmz files
- Click the small wrench (tools) in upper left of map window
- Set timezone to local
- Set to loop
- Set speed near middle of the slider, or even all the way to slow.
- Click the play icon to start the animation (the tiny clock-like icon at very top of page, towards left side of the control sub-window).
Movie…
I finally figured out how to record a movie of the Google Earth animation, so you don’t need to go through all the steps above. The .mp4 format video should open on your device when you click the play arrow. Let me know if it does not open and play. You can look for an icon at the upper left of the video to enlarge the display to fill your display. The local time of day is embedded in the video in the upper left corner. Once the whole video has loaded, you can grab the slider control and scroll forward and back in the video to try to figure out what is going on and correlate to the tidal cycle listed above..
Conclusions…
Anyone see any patterns? The current flow does not seem to sync with the times of high/low tide, except maybe at the start and end. But, surface currents are complicated, and may be driven by freshwater from inland and the weather, as much as by the tidal changes. And the tide is complicated on Casco Bay. The FVCOM simulation is available (for free) if there is anyone interested in pursuing this further.