
Z-Score
The z-score parameter measures how many standard deviations a boat’s finish position in any race is from the mean (average) of the collection of all its finishes prior to that race. The z-score, z, is calculated by the equation:
z = (x – x̄) / σ
where:
- x is the boat’s finish position,
- x̄ is the average of the boat’s prior finishes,
- σ is the standard deviation of the boat’s prior finishes.
Because this scoring method needs a couple races to seed the standard deviation and mean value calculations, the z-scoring starts with the third race.
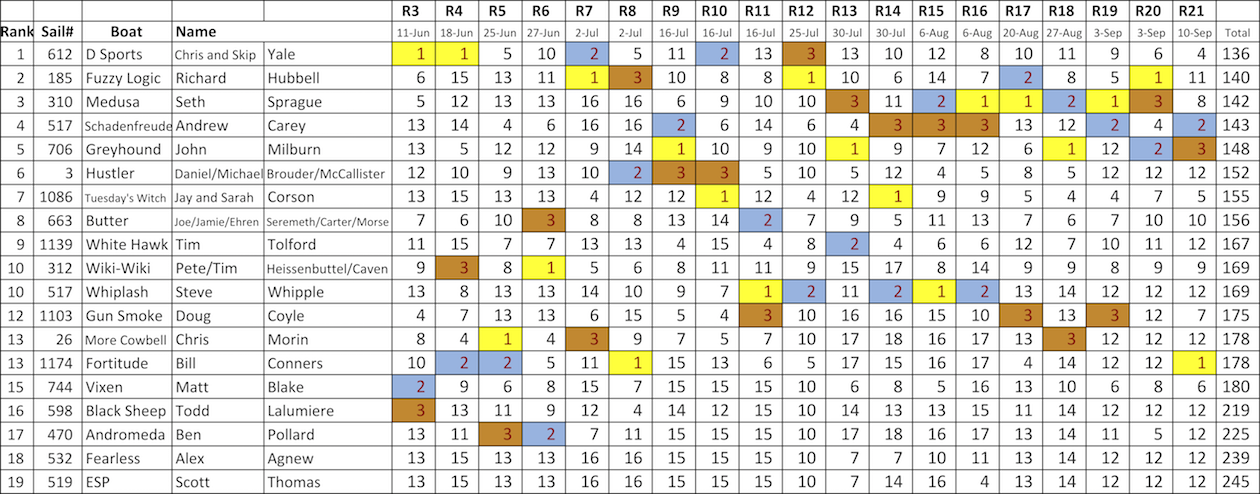
The raw z-scores are stacked against each other in each race and the boats are then ranked from best to worst z-score in each race. The rankings are totaled to give a series overall, but really the z-score approach is most useful at the individual race level.
Boat Rankings
This approach uses an eigenvalue solution to determine each boat’s score for the season. The standard eigenvalue problem is expressed as:
[Mp] {s} = c {s}
where:
- [Mp] is a square matrix with the probabilities of beating each other boat in the series by looking at head-to-head comparisons in each of the races in the series to date
- {s} is the column vector of boat scores (the eigenvector)
- c is a constant (the eigenvalue).
We start by creating a matrix, [M], which compiles the boat-vs-boat wins and is determined solely from the race finishes. Then, the matrix [Mp] is calculated based the probability that a boat beats the other boat by dividing each value in [M] by the number of head-to-head races between the two boats; this normalizes the matrix so that boats that sail more often do not get better scores just for sailing more often.
{s} is the vector containing each and every boat’s score; think of this vector as containing the numerical scores measuring each boat’s relative skill level. In the mathematics, when a boat beats a better boat, it collects more points towards its score than if it beats a less skilled boat. The score vector, {s}, falls out from performing the matrix arithmetic. Arguably, this method determines the most skilled boats without regard for the number of races that are sailed (i.e., no penalty for DNCs).
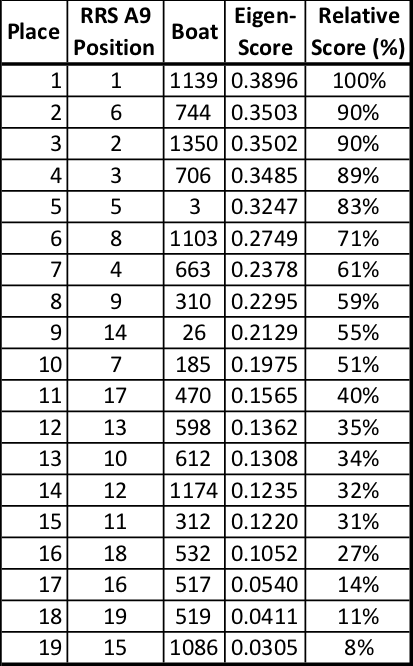
Solving this eigenvalue problem for the scores, and re-sorting the boats by their score, results in the following scores and relative rankings for the 2019 season. Also, the right-hand column prints each boat’s score relative to the top boat’s score.
The win matrix, [M], that tabulates the boat-vs-boat wins for all 21 races in 2019 is presented below. The matrix is annotated in the column and row headings with the boat sail numbers to help decipher the matrix values. The diagonal (yellow cells) is filled with zeroes, because no boat beats itself. Next, looking across the first row for boat 1139, it beat 1350 eleven times, beat 706 nine times, beat 663 fourteen times, and so on across the row. In addition, you can look down any boat’s column to see how many times that boat lost to the boat listed across the row to the left.
One item to note, at least 1350 did not lose any races to 517 in 2019! (For those that do not know, 1350 was purchased this year to replace 517.)
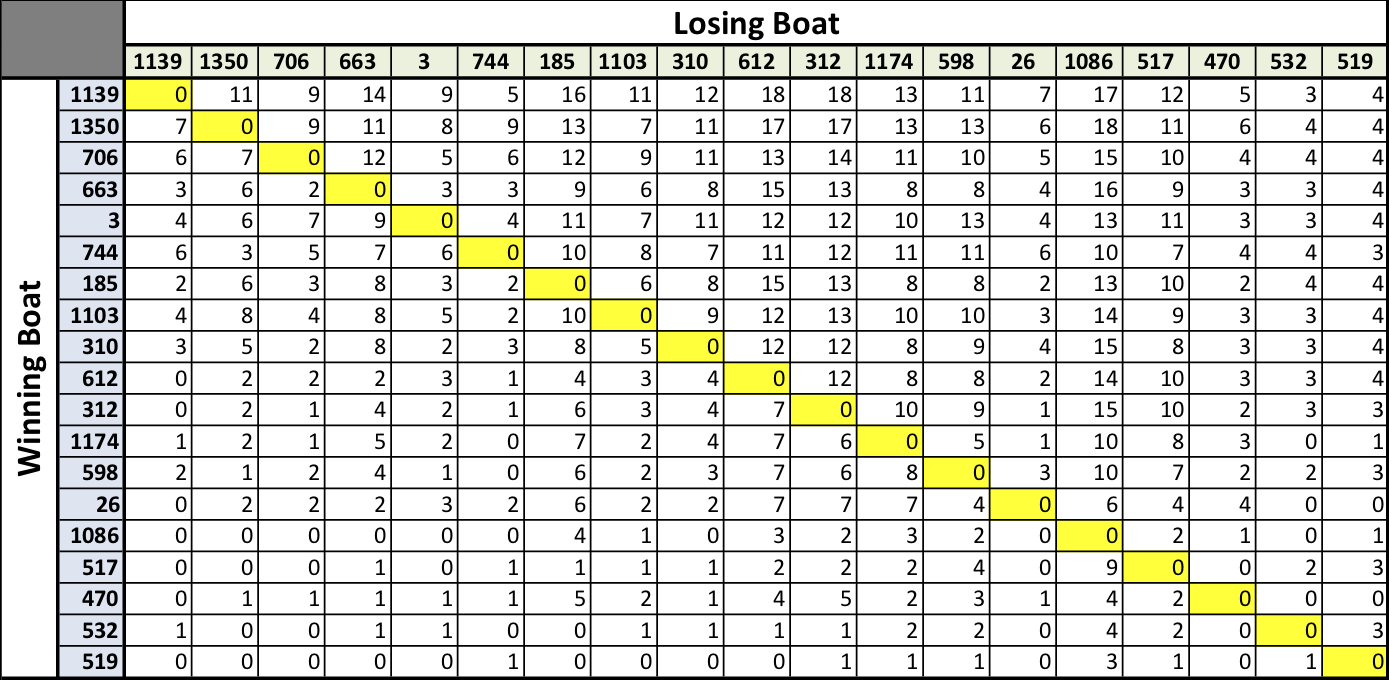
(Losses are Tabulated Down each Column)
Basis for a Handicap System
It would be interesting to then take the scores vector at the end of each race, {s}i, and multiply it by the individual race [M] matrix for the next race and see how the resulting scores rack and stack. That could be the basis for a workable handicap. Maybe the ratio of new score to prior score could be used to rank the boats on a handicap basis.